Take-home points
|
 |
Bios Dr. van der Emde is a researcher at the Division of Epidemiology and Clinical Applications, National Eye Institute, National Institutes of Health in Bethesda, Maryland, and a clinician scientist at the Department of Ophthalmology at the University of Bonn in Germany. Mr. Al Taweel is a 4th-year medical student at the University of Bonn. Dr. Keenan is a staff clinician in medical retinal disease at the National Eye Institute. This work was supported by the Intramural Research Program of the National Eye Institute, National Institutes of Health. |
Risk prediction is an essential task in non-advanced age-related macular degeneration. It’s important for patient counseling, personalized follow-up, reimaging, home monitoring plans and tailored recommendations of medical interventions. However, different approaches are appropriate in different settings.1–3 For clinical practice, approaches that prioritize simplicity and ease of use are typically most suitable. For that reason, exactly 20 years ago, the Age-Related Eye Diseases Study Research Group developed the AREDS Simplified Severity Scale for AMD.3 The idea was to provide a readily accessible severity scale for non-advanced AMD, so that clinicians could assign five-year progression risk levels that are easy to remember, based on simple grading achievable with either clinical examination or color fundus photography.
Here, we’ll explore the scale in detail, and describe the recent scale updates.
The original scale
In brief, one point is assigned for large drusen and for pigmentary abnormalities in each eye; these are summed between both eyes for a final score of 0-4. (In individuals with no large drusen, one point is assigned for medium-sized drusen in both eyes.) In the original scale, the five-year risk estimates were based on the outcome of advanced AMD, defined as neovascular AMD or central geographic atrophy. However, we now include non-central GA in our definitions of late AMD.4 Since GA is much more commonly non-central at incidence, and therapeutic approaches may increasingly be available to slow GA expansion to the central macula, accurate predictions of GA incidence should include all GA cases.5,6 Second, the original scale was based on just two macular features. However, we increasingly recognize reticular pseudodrusen as a third macular risk feature.7,8 RPD presence increases the risk of late AMD, even when taking into account the added risk from soft drusen and pigmentary abnormalities. This means that severity scales not considering RPD will tend to underestimate risk in eyes with RPD and tend to overestimate risk in eyes without RPD. These points provided the motivation for the AREDS and AREDS2 Research Groups to perform two sequential updates to the scale.4
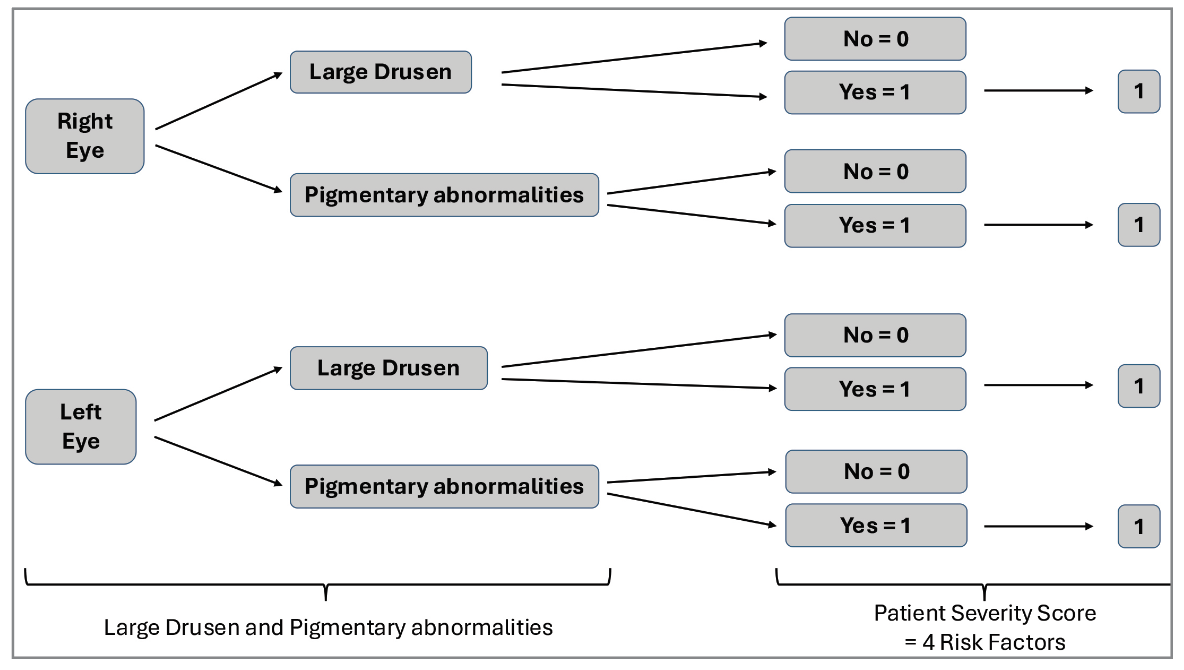 |
| Figure 1. The original AREDS AMD Simplified Severity Scale showing risk factor scoring and progression rates. Each eye is graded separately for large drusen and pigmentary abnormalities, based on clinical examination or color fundus photography, for a final score of 0-4 between both eyes. From this score, the five-year risk of progression to advanced age-related macular degeneration in either eye is read off the chart. |
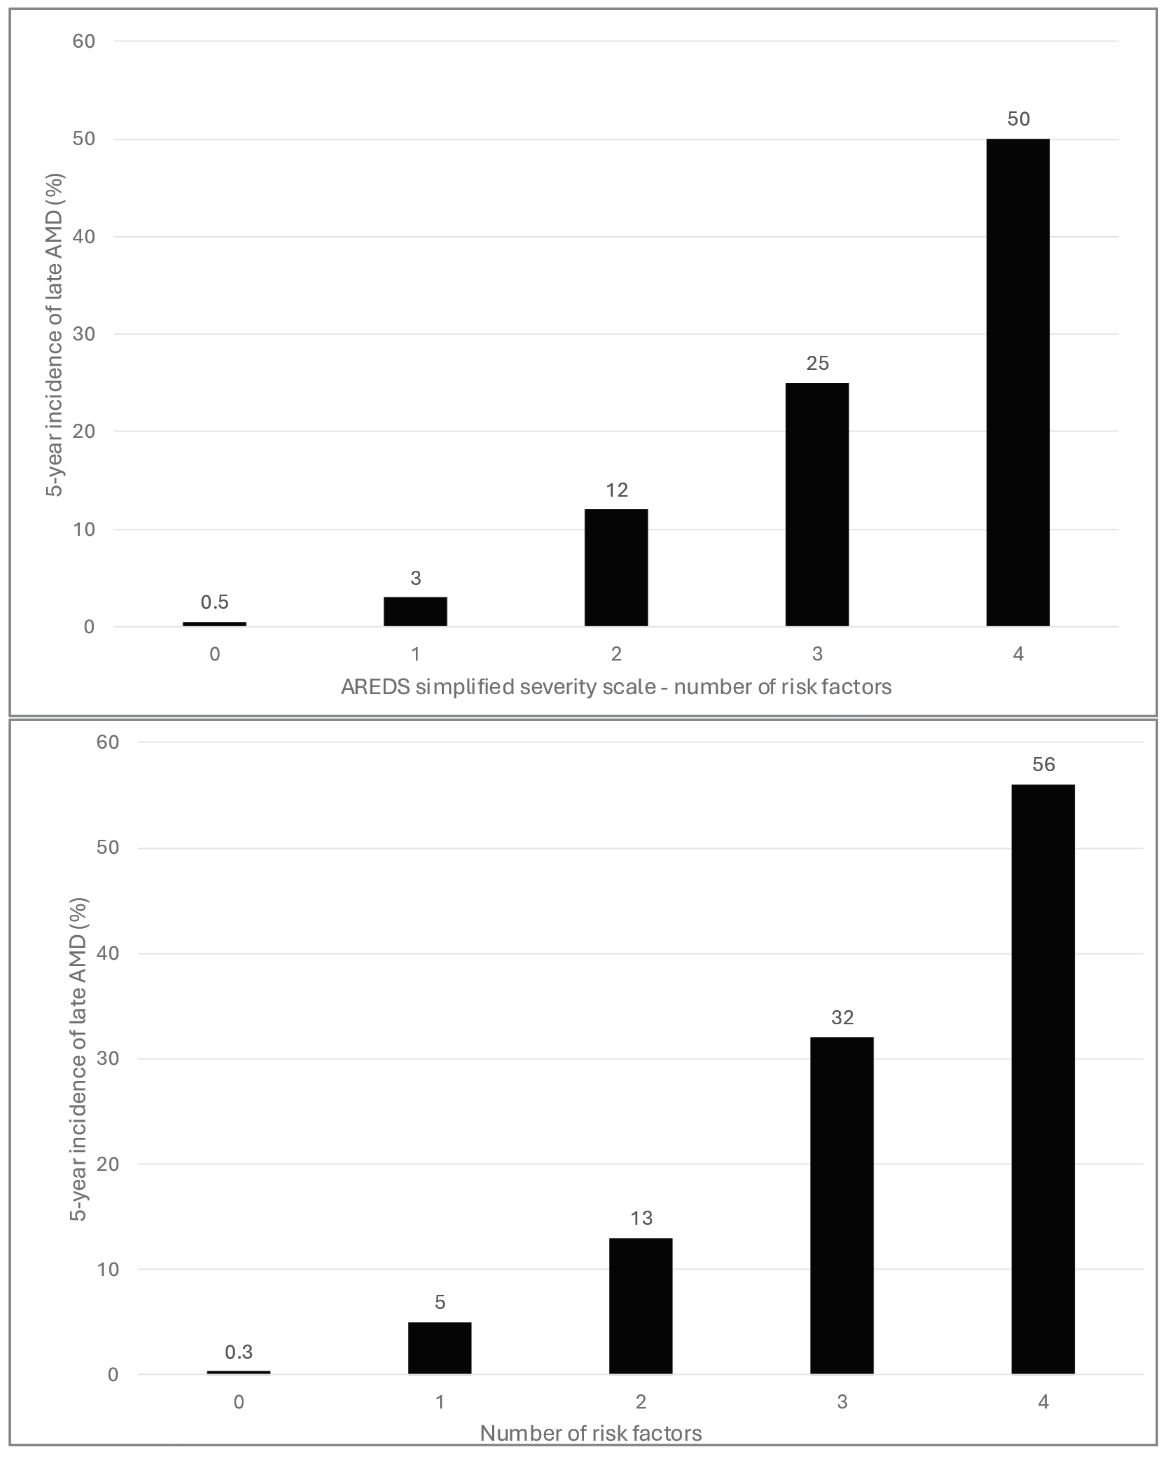 |
| Figure 2. (graphs at left) Comparison of the original AREDS Simplified Severity Scale with the new severity scale with the first update only. Original scale (Top). The new scale with the first update, including non-central geographic atrophy in the outcome (Bottom). |
The first scale update
The first update was including non-central GA in the outcome definition. The first update to the scale was made by recalculating the five-year risk estimates, using the original AREDS dataset, based on the modern definition of late AMD. In this way, non-central GA now forms part of the outcome, whereas it was previously considered a risk feature within the category of pigmentary abnormalities.
With this expanded outcome, we expected the risk estimates to increase, since non-central GA is twice as common as central GA in incidence.5 Interestingly, the risk estimates increased only marginally, because the change in outcome was offset by the narrowing in the definition of pigmentary abnormalities. In fact, the risk estimates are extremely similar to the original ones.3 In practice, this means that the original scale can continue to be used, despite the inclusion of non-central GA in the outcome.
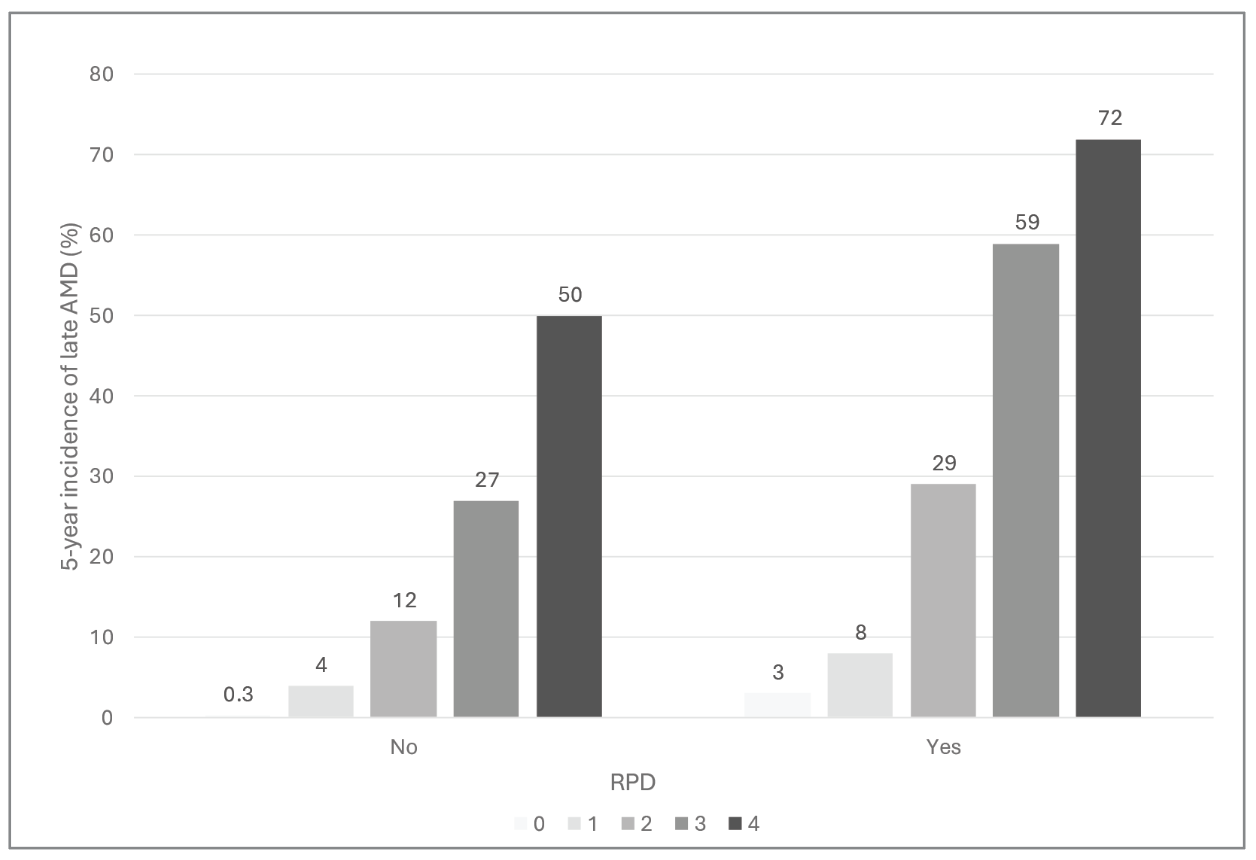 |
| Figure 3. Final updated AREDS AMD Simplified Severity Scale. Five-year rates of progression to late age-related macular degeneration in either eye are shown, according to reticular pseudodrusen presence in either eye (No = absent; Yes = present). |
Second scale update
The second update to the scale involved incorporating RPD status alongside the two existing features. One option was to develop a single scale with levels 0-6 (i.e., considering three features in each eye), by weighting all three features equally. However, this would have compromised both simplicity and accuracy, since the risk associated with large drusen is much greater than that associated with RPD.7,9 Instead, the most effective approach was to split the scale in two, by generating one scale for individuals with RPD and another for those without RPD. In this way, both scales continue to resemble the original version, with levels 0-4 graded from drusen and pigmentary abnormalities in the same way.3
For individuals without RPD, the risk estimates are approximately 0.5, 4, 12, 25 and 50 percent for levels 0-4. Fortuitously, these estimates are almost identical to the numbers from the original version. Of note, the scale retains the characteristic doubling from 12 percent to 25 percent to 50 percent, which makes the estimates easy to remember. In practice, this means that the original scale can still be used, provided the patient in question doesn’t have RPD in either eye.
For individuals with RPD, the risk estimates are notably higher, as expected, at approximately 3, 8, 30, 60, and 70 percent for levels 0-4. They’re approximately double those of the RPD-absent scale, over the medium levels. The degree of risk is more than double at the bottom of the scale, and less than double at the top, where risk is starting to become saturated. In practice, clinicians could either remember these values themselves or apply the rule of thumb that risk is approximately doubled for the middle levels, with exceptions at the extremes of the scale.
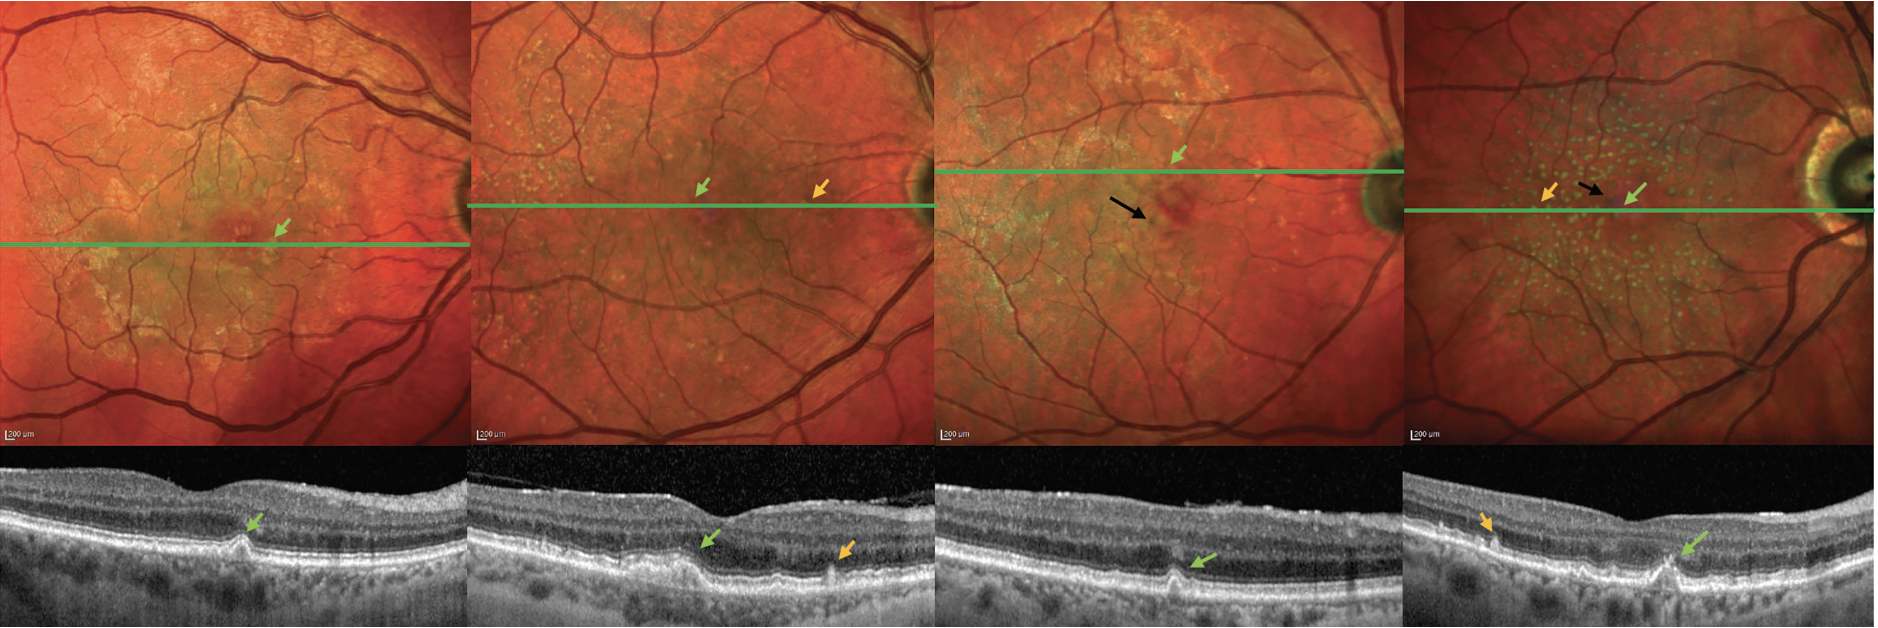 |
| Figure 4. Example cases, with and without reticular pseudodrusen, representing different levels of risk in the final Simplified Severity Scale. MultiColor confocal scanning laser ophthalmoscopy images with accompanying optical coherence tomography line scans, showing four representative eyes, with their five-year risks of progression to late age-related macular degeneration, based on the assumption of similar features in both eyes. (A) large drusen (green arrows), without RPD: 12 percent; (B) large drusen, with RPD (orange arrows): 29 percent; (C) large drusen and pigmentary abnormalities (black arrows), without RPD: 50 percent; (D) large drusen and pigmentary abnormalities, with RPD: 72 percent. |
Reticular pseudodrusen grading
Reading center grading of RPD status wasn’t available in the AREDS, as it predated the advent of multimodal imaging. To overcome this, RPD grades were provided by artificial intelligence grading of the AREDS color fundus photographs. Specifically, the authors used 8,000 CFP-fundus autofluorescence image pairs from the AREDS2 to train a deep-learning algorithm to detect RPD presence on CFP.10,11 The algorithm demonstrated accurate performance on a hold-out test set from the AREDS2, as well as on an independent European dataset. Since it did miss a small number of cases with RPD, the five-year risk estimates might be slightly overestimated in the RPD-absent scale, though the algorithm’s performance may be relatively similar to the sensitivity and specificity levels anticipated in routine clinical practice, where very subtle cases of RPD might be missed.
Grading RPD in clinical practice is achievable, since they’re detected most accurately on OCT (as well as near-infrared reflectance, which often accompanies OCT imaging – Figure 5).12,13 For clinicians less familiar with RPD grading, artificial intelligence algorithms will increasingly be available for automated detection, or the RPD-agnostic scale can be used.
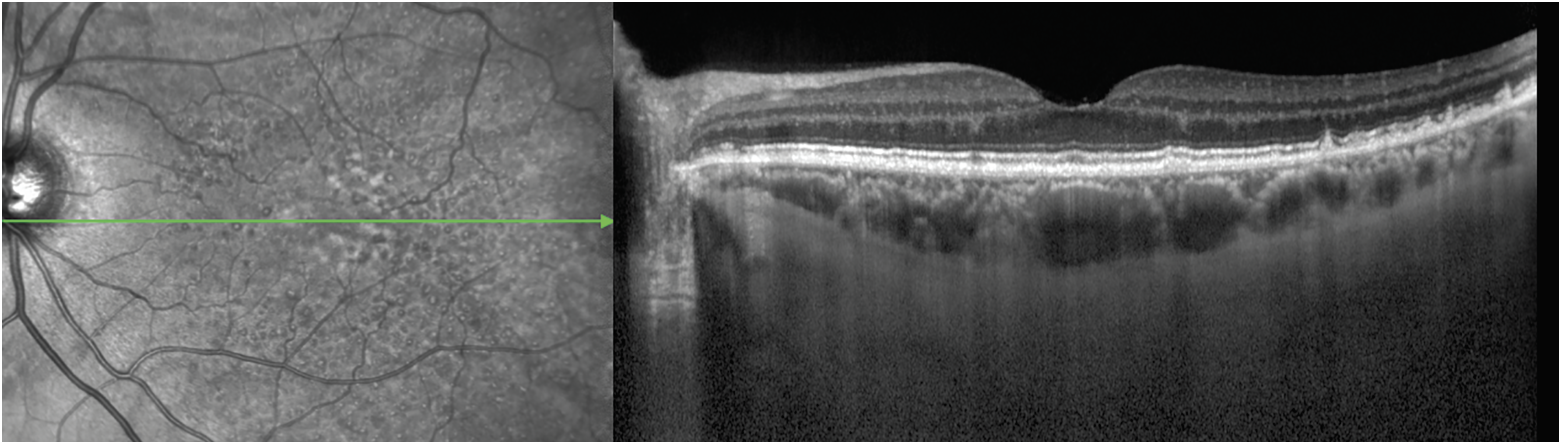 |
| Figure 5. Reticular pseudodrusen on near-infrared reflectance (left) and optical coherence tomography (right) imaging. The NIR image demonstrates the RPD as an extensive interlacing network of hyporeflective lesions surrounding by areas of hyperreflectivity. Some lesions have a target appearance. The OCT image shows the RPD as hyperreflective material above the retinal pigment epithelium, particularly in the far temporal macula. Some lesions are seen as mounds of hyperreflective material that alter the ellipsoid zone (EZ, i.e., stage 2), whereas others are conical and break through the EZ (i.e., stage 3; green arrow). Temporal to the fovea, soft drusen are also observed, comprising nonconical lesions of hyperreflective material below the RPE. |
External validation on the AREDS2 dataset
All three new scales also underwent successful external validation on the independent AREDS2 dataset. Given that the AREDS and AREDS2 datasets were developed from 11 and 82 clinical sites across the United States, respectively, the scales are likely to be highly generalizable. However, both datasets were based on predominantly Caucasian study populations, so the generalizability of the scales to other populations is unknown.
Bottom line
The AREDS Simplified Severity Scale has undergone two important updates. The first update results in an RPD-agnostic scale that fits modern definitions of late AMD by including non-central GA in the outcome. The risk estimates are only marginally higher than the original scale. The second update enhances predictive accuracy by incorporating RPD. The scale is split in two. The RPD-absent scale has risk estimates that are almost identical to the original scale. The RPD-present scale has risk estimates that are approximately double. Overall, the updated AREDS Simplified Severity Scale offers a refined, clinically relevant tool for predicting progression to late AMD. It has enhanced prognostic accuracy but remains simple for accessible risk categorization in clinical practice. RS
REFERENCES
1. Davis MD, Gangnon RE, Lee L-Y, et al. The Age-Related Eye Disease Study severity scale for age-related macular degeneration: AREDS Report No. 17. Arch Ophthalmol. 2005;123:1484–1498.
2. Klein ML, Francis PJ, Ferris FL, et al. Risk assessment model for development of advanced age-related macular degeneration. Arch Ophthalmol. 2011;129:1543–1550.
3. Ferris FL, Davis MD, Clemons TE, et al. A simplified severity scale for age-related macular degeneration: AREDS Report No. 18. Arch Ophthalmol. 2005;123:1570–1574.
4. Agrón E, Domalpally A, Chen Q, et al. An updated simplified severity scale for age-related macular degeneration incorporating reticular pseudodrusen: Age-Related Eye Disease Study Report Number 42. Ophthalmology. 2024;131:1164-1174.
5. Keenan TD, Agrón E, Domalpally A, et al. Progression of geographic atrophy in age-related macular degeneration: AREDS2 Report Number 16. Ophthalmology. 2018;125:1913-1928.
6. Huang A, Wu Z, Ansari G, et al. Geographic atrophy: Understanding the relationship between structure and function. Asia Pac J Ophthalmol (Phila). 2025:100207.
7. Agrón E, Domalpally A, Cukras CA, et al. Reticular pseudodrusen: The third macular risk feature for progression to late age-related macular degeneration: Age-Related Eye Disease Study 2 Report 30. Ophthalmology. 2022;129:1107-1119.
8. Trinh M, Cheung R, Duong A, et al. OCT prognostic biomarkers for progression to late age-related macular degeneration: A systematic review and meta-analysis. Ophthalmol Retina. 2024;8:553–565.
9. Trinh M, Cheung R, Duong A, et al. OCT prognostic biomarkers for progression to late age-related macular degeneration: A systematic review and meta-analysis. Ophthalmol Retina. 2024;8:553–565.
10. Keenan TDL, Chen Q, Peng Y, et al. Deep learning automated detection of reticular pseudodrusen from fundus autofluorescence images or color fundus photographs in AREDS2. Ophthalmology. 2020;127:1674–1687.
11. Chen Q, Keenan TDL, Allot A, et al. Multimodal, multitask, multiattention (M3) deep learning detection of reticular pseudodrusen: Toward automated and accessible classification of age-related macular degeneration. J Am Med Inform Assoc. 2021;28:1135–1148.
12. Wu Z, Fletcher EL, Kumar H, et al. Reticular pseudodrusen: A critical phenotype in age-related macular degeneration. Prog Retin Eye Res. 2021:101017.
13. Spaide RF, Ooto S, Curcio CA. Subretinal drusenoid deposits AKA pseudodrusen. Surv Ophthalmol. 2018;63:782–815.