Take-home points
|
 |
Bio Dr. Salcedo Villanueva is a retina specialist at the Retina Department of the Asociación Para Evitar la Ceguera en México (APEC) and at Clínica de Ojos Condesa in Mexico City. He has no financial interest in the material presented. |
Fluorescein angiography is a fundamental imaging technique in ophthalmology. It provides a dynamic assessment of the anatomy and physiology of the posterior segment by visualizing normal and abnormal filling patterns and leakage in different vascular compartments, principally the retinal and choroidal circulations. Since its development by Novotny and Alvis in the 1960s,1 FA has served as one of the gold standards for diagnostic imaging in ophthalmology and is generally considered a safe procedure.
However, FA has notable limitations. It’s an invasive test that requires intravenous access and is therefore associated with adverse events related to fluorescein administration. These reactions may be mild (1.24 to 17.5 percent), including nausea (0.06 to 15.29 percent), vomiting (0.2 to 8.0 percent) and extravasation (0.1 to 2.65 percent); moderate (0.2 to 6.0 percent), including rash/urticaria (0.2 to 4.5 percent) and syncope/dizziness/hypotension (0.04 to 1.2 percent); or severe (0.04 to 0.59 percent), including anaphylaxis/bronchospasm (0.03 to 0.38 percent) and myocardial infarction (0.01 to 0.15 percent). The estimated mortality rate ranges from 1:100,000 to 1:220,000.2,3
Because of the invasive nature of IVFA and the potential for adverse events, frequent repetition of the test is limited, particularly in diseases where serial imaging may be beneficial, such as posterior uveitis, intermediate uveitis and retinal vasculitis. Although newer non-invasive imaging modalities such as optical coherence tomography angiography provide valuable information, there remain clinical scenarios, such as retinal vasculitis, where FA is essential for assessing disease activity.
Recent advances in imaging systems, particularly confocal scanning laser ophthalmoscopes including the Clarus 700 (Carl Zeiss Meditec AG, Jena, Germany) and Optos California (Optos plc, Dunfermline, Scotland), have improved image quality and acquisition speed. Scanning times range from <0.2 to 0.5 seconds, providing optical resolution between 7.3 to 14 µm. Improved visualization of fine details may allow adequate imaging with lower concentrations of fluorescein or with orally administered fluorescein.
Oral FA has been described primarily in pediatric populations and has been used with various reflectance imaging systems such as the Visucam (Carl Zeiss Meditec AG, Jena, Germany).4,5 As noted above, improvements in cSLO technology have enhanced OFA image quality.4 Although fluorescein doses for oral administration have been studied—mainly in children—there’s limited information on optimal dosing, absorption kinetics, and transit time in adults.6,7
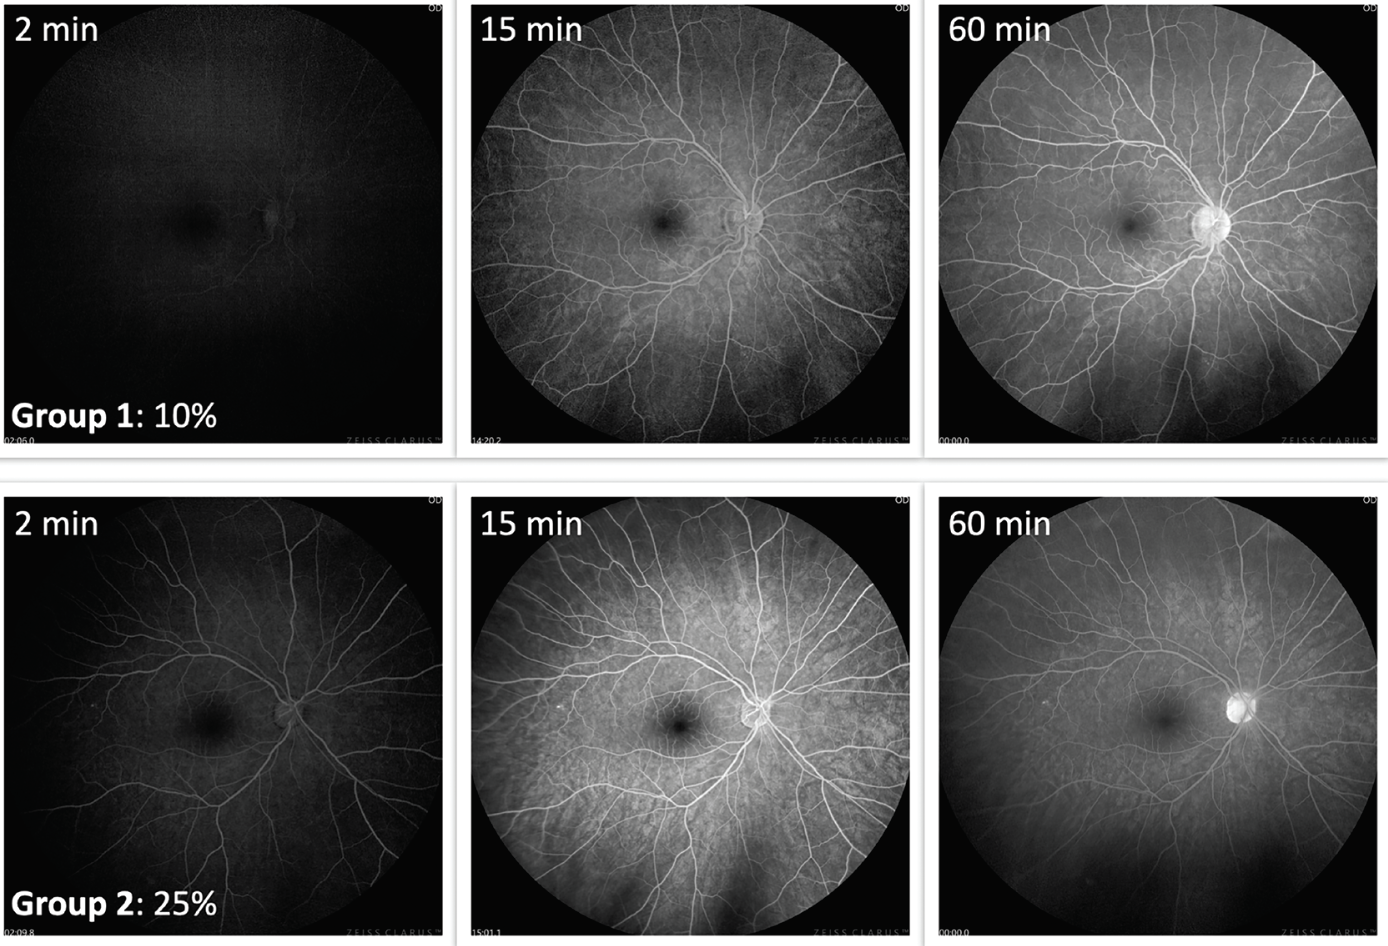 |
| Figure 1. Examples from two subjects that showed early fluorescence at two minutes. Top images show the subject that ingested 10% fluorescein; lower images show the subject that ingested 25% fluorescein. Notice how clear fundus features are observable in both cases. Twenty-five percent shows a brighter image at 15 minutes. However, both concentrations show an adequate fluorescence at 60 minutes. This project was presented at ARVO 2023.8 |
To address these gaps, we conducted a small cross-sectional pilot study to compare 10% and 25% oral fluorescein in healthy young adults.8 We recruited 19 subjects divided into two groups and administered either 10% or 25% fluorescein. Participants fasted for at least seven hours and then consumed 4 mL of the assigned concentration diluted in 30 mL of cold orange juice, taken in a single gulp if possible. Images were obtained using the Clarus 700, and a timer was started at the moment of ingestion. Images were captured as follows:
- Every minute from 0 to 10 minutes
- Every five minutes from 10 to 30 minutes
- Every 10 minutes from 30 to 60 minutes
All participants were monitored for adverse events during the procedure and for 30 minutes afterward. For image analysis, we used ImageJ and applied the histogram function to measure fluorescence intensity through the mean gray value for each image. These values range from 0 (completely dark) to 255 (completely white).
Findings
Mean overall fluorescence was 32.55 pixels (P) (standard deviation [SD]: 24.75) for 10% fluorescein and 38.62 P (SD: 29.68) for 25% fluorescein (p=0.08). Mean time to initial fluorescence was 11.5 minutes for 10% and 8.2 minutes for 25% (p=0.464). Maximal fluorescence reached 62.79 P for 10% and 72.18 P for 25% (p=0.195). No adverse events were observed.
Although 25% fluorescein produced higher fluorescence, the 10% concentration also generated adequate visualization of fundus structures (Figure 1). In the examples provided, early fluorescence was detectable as early as two minutes with both concentrations; image quality improved significantly by 15 minutes and persisted through 60 minutes, providing good visualization of posterior segment structures. Importantly, a notable increase in fluorescence occurred between 10 and 15 minutes. We therefore consider approximately 15 minutes to represent the optimal peak phase for image acquisition. Although fluorescence continues to increase over the first 60 minutes, obtaining the initial and most critical images at around 15 minutes is recommended.
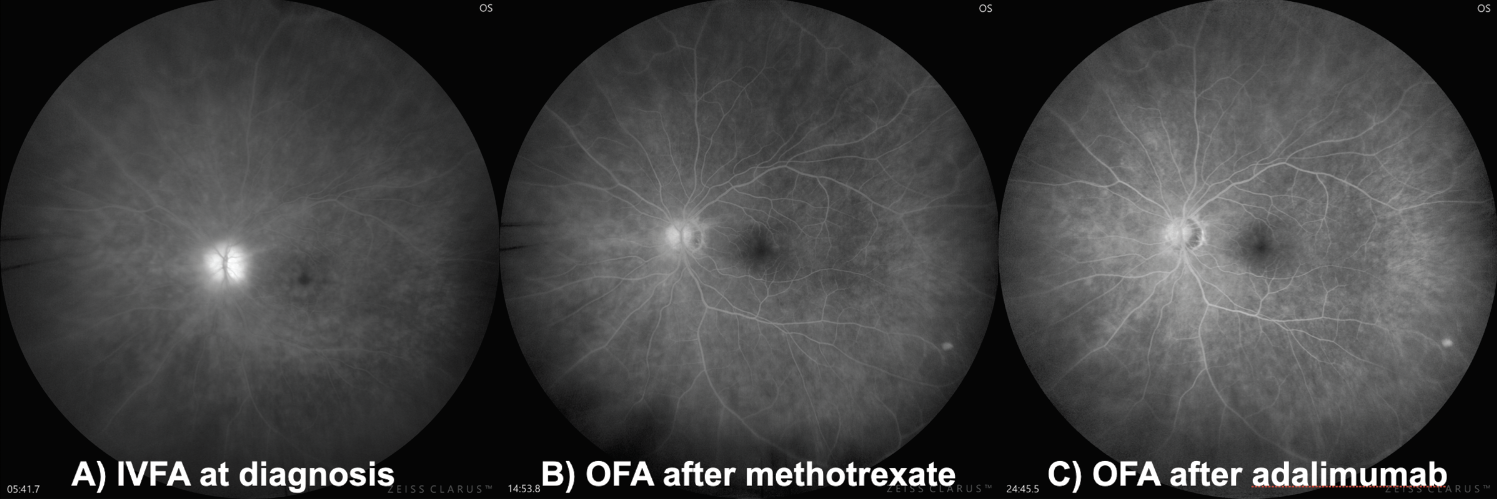 |
| Figure 2. Patient with probable Behçet’s Disease. A) The patient at baseline with IVFA. B) Since the patient needed continued evaluation with FA, oral administration was proposed. The patient is shown with methotrexate was initiated. C) After initiation with adalimumab. |
Is oral FA useful in clinical settings?
We believe so. Despite requiring a larger volume of fluorescein and taking longer than IVFA, OFA doesn’t require venous access and therefore doesn’t disrupt clinic workflow. A patient may ingest the dye while undergoing dilation, and images can be obtained after 15 minutes. When using an ultra-widefield imaging system, just a few images will be enough for a good assessment of the disease. Following brief observation for adverse events, the patient can be discharged.
This offers a practical alternative in conditions where repeated FA might be beneficial. Figure 2 shows a patient with retinal vasculitis due to a probable Behçet’s disease. For her follow-up it’s important to observe if vasculitis is subsiding with systemic treatment, and OFA has been helpful in providing that information in practically all her appointments (Figure 2).
To explore the clinical applications of OFA, we performed a second experiment assessing image quality in patients with diabetic retinopathy compared with IVFA.9 Two masked graders evaluated and graded, on a scale from 0 to 3 points, each of the following features:
- Visualization of the retinal vasculature.
- Visualization of the foveal avascular zone (FAZ).
- Visualization of DR features, including diabetic macular edema, neovascularization, and microaneurysms.
Fluorescence intensity was again measured using mean gray value, and safety was assessed through adverse event monitoring.
Findings
The mean quality score was 8.54 (SD: 1.15) for OFA and 8.89 (SD: 0.24) for IVFA (p=0.285). Image quality was rated excellent in 81 percent of OFA images and 86 percent of IVFA images; moderate in 17 percent vs. 12 percent; and poor in 2 percent for both. Mean fluorescence was 76.38 p (SD: 21.76) for OFA and 78.79 p (SD: 22.83) for IVFA which showed no statistical significance difference. Unexpectedly, we observed two mild adverse events (3.12 percent) in the OFA group—one case of nausea and one rash—and none in the IVFA group.
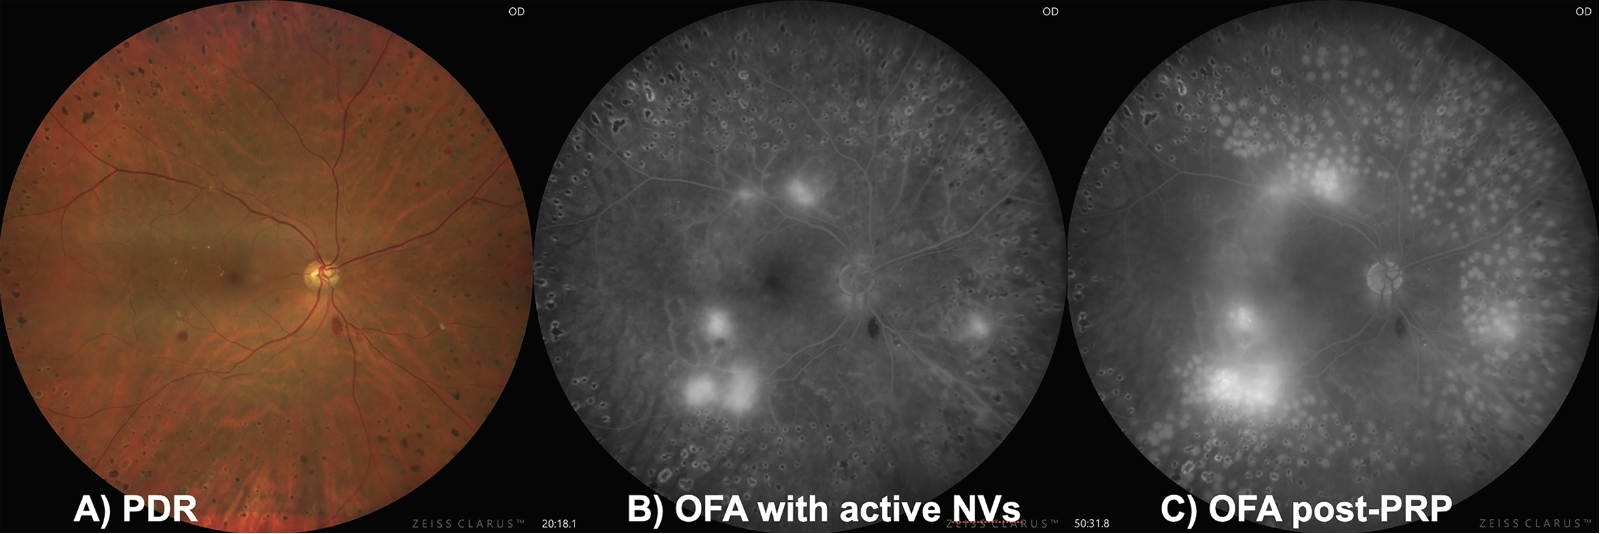
Based on these findings, OFA appears to permit excellent visualization of DR features, comparable to IVFA. Fluorescence intensity was similar between modalities, and OFA may represent a useful imaging tool in selected clinical settings, particularly in diabetic patients. For example, you could perform a routine OFA on a proliferative DR patient, where you could easily detect the presence of neovascularization. The patient could get laser photocoagulation and again return for another OFA (with the same, initial dose of fluorescein) to compare and grade how laser was given (Figure 3).
 |
|
Figure 3. A) Patient with proliferative diabetic retinopathy with active retinal neovascularization. B) The patient undergoes an OFA that pin-points the location of the active NV. C) After laser, that patient can return to complete the FA (with the same initial dose of oral fluorescein) to evaluate if the photocoagulation was adequately administered. |
Practical recommendations
Both 10% and 25% concentrations may be used for OFA. In routine practice, we use 25% due to subjectively better image quality, higher fluorescence and faster onset. We recommend:
1. Administer 4 mL of 25% fluorescein diluted in 30 mL of cold orange juice.
2. Start the timer at ingestion; allow absorption while the patient continues dilation in the waiting room.
3. Initial images can be obtained at five minutes, but optimal fluorescence is typically reached after 15 minutes. Repeat imaging if fluorescence appears insufficient.
4. Monitor all of the patients for adverse events. RS
REFERENCES
1. Novotny HR, Alvis DL. A method of photographing fluorescence in circulating blood in the human retina. Circulation 1961;24:82-6.
2. Yannuzzi LA, Rohrer KT, Tindel LJ, et al. Fluorescein angiography complication survey. Ophthalmology 1986;93:5:611e7.
3. Kornblau IS, El-Annan JF. Adverse reactions to fluorescein angiography: A comprehensive review of the literature. Surv Ophthalmol 2019;64:5:679-693.
4. Azad RV, Baishya B, Pal N, Sharma YR, Kumar A, Vohra R. Comparative evaluation of oral fluorescein angiography using the confocal scanning laser ophthalmoscope and digital fundus camera with intravenous fluorescein angiography using the digital fundus camera. Clin Exp Ophthalmol 2006;34:5:425.
5. Jiang Z, Sun L, Hou A, Zhang T, Lai Y, Huang L, Ding X. Oral fluorescein angiography with ultra-wide-field scanning laser ophthalmoscopy in pediatric patients precis: Oral fluorescein angiography in children. J Clin Med 2022;15:11:18:5421. doi: 10.3390/jcm11185421. PMID: 36143067; PMCID: PMC9500735.
6. Barteselli G, Chhablani J, Lee SN, Wang H, El Emam S, Kozak I, Cheng L, Bartsch DU, Azen S, Freeman WR. Safety and efficacy of oral fluorescein angiography in detecting macular edema in comparison with spectral-domain optical coherence tomography. Retina 2013;33:8:1574-83.
7. Marmoy OR, Henderson RH, Ooi K. Recommended protocol for performing oral fundus fluorescein angiography (FFA) in children. Eye (Lond) 2022;36:1:234-236.
8. Salcedo-Villanueva G, Ortega-Desio A, Jacome FA, et al. Comparison of 10% and 25% fluorescein for oral retinal fluorescein angiography. Invest Ophthalmol Vis Sci 2023;64:8:2077.
9. Alonzo C, Salcedo-Villanueva G, Fromow-Guerra J. Oral fluorescein angiography in diabetic retinopathy, comparative cases with intravenous fluorescein angiography. Invest Ophthalmol Vis Sci 2024;65:9:PB0081.