Take-home points
|
 |
Bios Dr. Chujo is a research fellow at the Doheny Image Reading and Research Lab in Pasadena, Calif., and an assistant professor of ophthalmology and vitreoretinal surgeon at Mie University Graduate School of Medicine, Japan. |
Geographic atrophy is a leading cause of irreversible vision loss worldwide.1,2 Affecting more than 5 million individuals globally, its prevalence is expected to increase with the aging of the population.3 Though the pace can vary, GA enlarges progressively and irreversibly, ultimately causing substantial visual impairment when the lesion involves the fovea.4 Recent advances, including the approval of complement inhibitors and the development of gene therapies, have made slowing GA progression a realistic therapeutic goal.5–10
Consequently, accurate assessment of disease progression has become increasingly important. However, many clinical trials have demonstrated only a modest association between structural outcomes, such as the rate of GA enlargement, and functional outcomes, including visual acuity.11 One possible explanation is that conventional metrics, which primarily quantify GA lesion area, don’t adequately account for lesion location, direction of expansion or morphological characteristics.
For example, two eyes may exhibit the same increase in lesion area yet have markedly different effects on visual function depending on whether the lesion expands toward the fovea or into the more peripheral retina. Accordingly, increasing attention has been directed toward novel imaging biomarkers and analytical approaches that incorporate not only lesion size but also the spatial characteristics of GA progression.
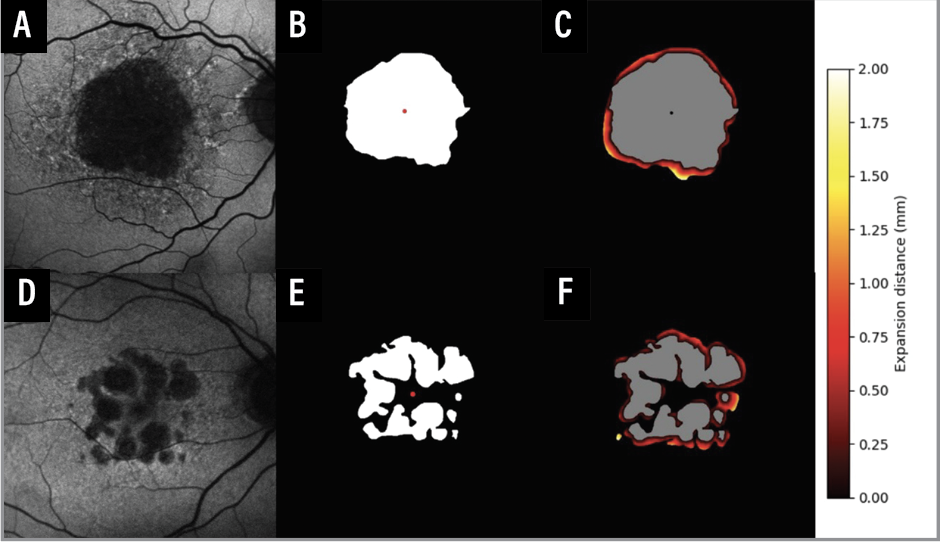 |
| Figure 1. Workflow for calculating geographic atrophy lesion front displacement. Original fundus autofluorescence image (A). Binary GA lesion mask generated using the Spectralis Region Finder (B). Heatmap of lesion margin expansion generated using a Euclidean distance map (C). In eyes with multifocal GA, each lesion was segmented and divided into 12 clock-hour sectors, allowing quantification of the overall directional pattern of lesion expansion (D-F). Adapted from: Chujo et al. Ophthalmol Sci. 2026;6(7):101198. |
Advantages of Assessing GA by Lesion Front Displacement
Traditionally, GA progression has been assessed using metrics such as total lesion area, square root–transformed lesion area and lesion perimeter.1,12–17 While these measures are useful for quantifying the overall extent of atrophy, they are influenced by lesion morphology and changes in lesion configuration. For example, lesions with identical rates of marginal expansion may exhibit different rates of area enlargement depending on their shape. Likewise, mergers between multiple individual atrophic foci or the emergence of new atrophic foci can alter lesion perimeter, complicating the interpretation of growth rates.18,19
To address these limitations, our group proposed a novel metric, termed the GA lesion front displacement.20 Rather than quantifying changes in lesion area, this approach directly measures the distance that the atrophic border advances over time. Similar to measuring the retreat of a coastline, lesion front displacement focuses on the movement of the lesion margin itself rather than the total area affected (Figure1).
This approach offers several potential advantages. First, because it directly measures border advancement, it’s less dependent on lesion shape and is therefore more robust in the presence of merging multifocal lesions or changes in lesion morphology. Second, it enables localized assessment of disease progression, allowing regional differences in lesion expansion to be quantified rather than averaged across the entire lesion. Finally, it allows for the expansion of the lesion to be more easily adjusted for location of the border and the direction of expansion. Importantly, by evaluating progression at the lesion border, lesion front displacement may provide a more sensitive metric for assessing treatment response in individual patients. Taken together, lesion front displacement complements conventional area-based metrics and represents a more direct, morphology-independent approach to quantifying GA progression.
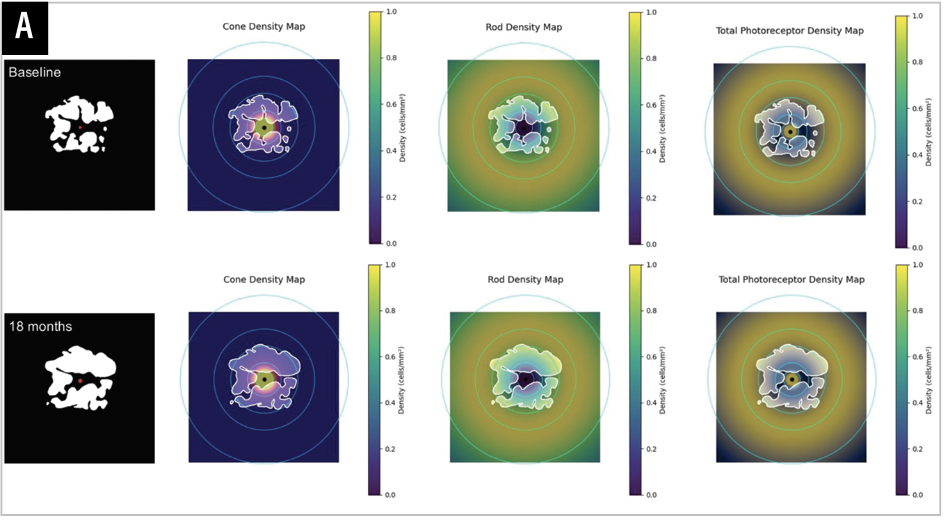 |
| Figure 2. Spatial assessment of geographic atrophy progression using photoreceptor density maps. Cone, rod and total photoreceptor density maps generated from published histological data were overlaid with baseline and 18-month GA lesion masks. The red dot indicates the foveal center. Lesion expansion was quantified according to the underlying photoreceptor density distribution by measuring both Δphotoreceptor loss and ΔGA area within concentric rings centered on the fovea. This approach enables evaluation of GA progression based not only on lesion enlargement but also on the retinal cellular environment into which the lesion expands. Adapted from: Chujo et al. Ophthalmol Sci. 2026;6(7):101198. |
A Photoreceptor Density-Based Approach to Evaluating Geographic Atrophy Progression
Based on histological photoreceptor density data, we generated a theoretical photoreceptor density map (Figure 2) and developed a novel metric, termed photoreceptor-adjusted front, in which lesion front displacement is normalized according to the local photoreceptor density.
Using the conventional front displacement metric, lesion expansion appeared to occur preferentially toward the peripheral retina. However, after adjustment for photoreceptor density, this directional difference was markedly attenuated. Furthermore, the directional variability of lesion progression was also reduced, suggesting that at least part of the apparent directional preference of GA expansion may be explained by the nonuniform spatial distribution of retinal photoreceptors. These findings demonstrate that incorporating retinal cellular architecture into structural imaging analyses may provide new biological insights into GA progression and may complement conventional approaches based solely on lesion enlargement.
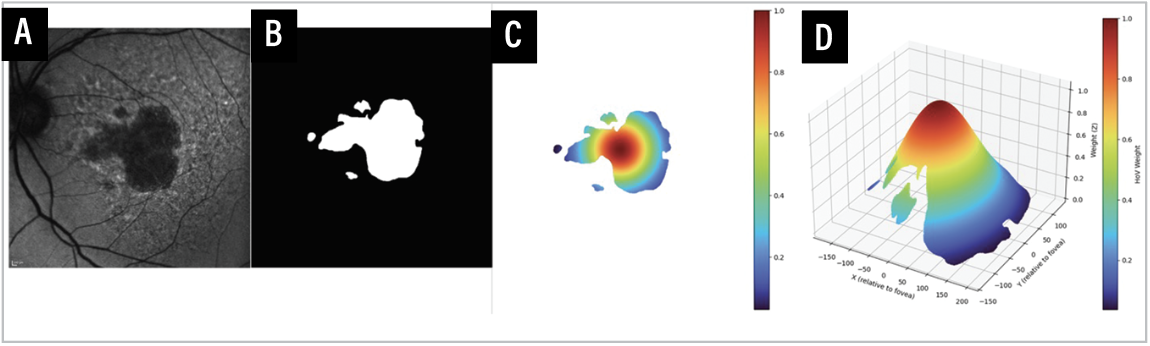 |
| Figure 3. Generation of hill of vision-inspired severity maps from fundus autofluorescence images of geographic atrophy. Fundus autofluorescence image (A). Binary GA lesion mask (B). Two-dimensional severity heatmap generated by Gaussian weighting of GA lesion pixels (C). Three-dimensional visualization of the GA Severity Score (D). Warmer colors indicate greater lesion severity. Adapted from: Chujo S, et al. Graefes Arch Clin Exp Ophthalmol. 2026. |
A Severity Score Beyond Lesion Area
Lesion area remains the most widely used metric for assessing GA progression. However, the clinical significance of lesion enlargement isn’t determined solely by its size. Two eyes may exhibit the same increase in lesion area yet have markedly different functional consequences depending on where the lesion expands. For example, enlargement toward the peripheral retina is likely to have a different impact on visual function than enlargement toward the fovea. Nevertheless, conventional area-based metrics treat both scenarios as an equivalent increase in lesion size. To address this limitation, our group recently proposed a novel GA Severity Score inspired by the concept of the Hill of Vision (HOV) (Figure 3).23
Rather than evaluating lesion area alone, this approach incorporates the spatial relationship between the lesion and the fovea by assigning greater weight to atrophy occurring closer to the foveal center. Importantly, the GA Severity Score isn’t a direct measure of visual function. Instead, it provides a spatially-weighted structural assessment that captures aspects of disease severity not reflected by lesion area alone. By incorporating lesion location into the evaluation of GA progression, this metric may better represent the potential functional impact of lesion enlargement. Although further validation against visual acuity, microperimetry and other functional outcomes is needed, the GA Severity Score may serve as a valuable complementary biomarker for monitoring disease progression and evaluating treatment response.
Future Perspectives for GA Management
The introduction of complement inhibitors has marked a major turning point in the management of GA. Rather than simply documenting lesion enlargement, clinicians are now increasingly required to determine which patients are most likely to benefit from treatment and whether therapy is effectively altering the course of disease.
Meeting these challenges will require more than conventional area-based measurements. Evaluating where the lesion is expanding and which retinal regions are being affected may provide clinically meaningful information beyond lesion size alone. Lesion front displacement quantifies the direction and rate of lesion expansion, photoreceptor-adjusted front incorporates the underlying retinal cellular architecture and the GA Severity Score reflects the spatial importance of lesion location relative to the fovea. Together, these complementary approaches have the potential to improve assessment of disease progression and treatment response by capturing information that’s not reflected in lesion area alone.
Looking ahead, integration of these imaging biomarkers with artificial intelligence–based prediction models may enable more accurate risk stratification, individualized treatment planning and earlier identification of eyes at greatest risk for vision loss. Although these methods remain investigational and require further clinical validation, they highlight an important shift in the evaluation of GA—from measuring how much atrophy has developed to understanding where and how it’s progressing. This spatially informed approach may ultimately contribute to more personalized and clinically meaningful management of patients with GA. RS
REFERENCES
1. Fleckenstein M, Mitchell P, Freund KB, et al. The progression of geographic atrophy secondary to age-related macular degeneration. Ophthalmology 2018;125:369-390.
2. Sarks JP, Sarks SH, Killingsworth MC. Evolution of geographic atrophy of the retinal pigment epithelium. Eye 1988;2:552-577.
3. Wong WL, Su X, Li X, et al. Global prevalence of age-related macular degeneration and disease burden projection for 2020 and 2040: A systematic review and meta-analysis. Lancet Glob Health 2014;2:e106-e116.
4. Change in area of geographic atrophy in the Age-Related Eye Disease Study: AREDS report number 26. Arch Ophthalmol 2009;127:1168.
5. Khanani AM, Patel SS, Staurenghi G, et al. Efficacy and safety of avacincaptad pegol in patients with geographic atrophy (GATHER2): 12-month results from a randomised, double-masked, phase 3 trial. Lancet 2023;402:1449-1458.
6. Wykoff CC, Rosenfeld PJ, Waheed NK, et al. Characterizing new-onset exudation in the randomized phase 2 FILLY trial of complement inhibitor pegcetacoplan for geographic atrophy. Ophthalmology 2021;128:1325-1336.
7. Jamil MU, Waheed NK. Gene therapy for geographic atrophy in age-related macular degeneration: Current insights. Eye 2025;39:274-283.
8. Heier JS, Lad EM, Holz FG, et al. Pegcetacoplan for the treatment of geographic atrophy secondary to age-related macular degeneration (OAKS and DERBY): Two multicentre, randomised, double-masked, sham-controlled, phase 3 trials. Lancet 2023;402:1434-1448.
9. Heier JS, Cohen MN, Chao DL, et al. Phase 1 study of JNJ-81201887 gene therapy in geographic atrophy secondary to age-related macular degeneration. Ophthalmology 2024;131:1377-1388.
10. Boyer DS, Schmidt-Erfurth U, Van Lookeren Campagne M, Henry EC, Brittain C. The pathophysiology of geographic atrophy secondary to age-related macular degeneration and the complement pathway as a therapeutic target. Retina 2017;37:819-835.
11. Lad EM, Fleckenstein M, Holz FG, et al. Informing endpoints for clinical trials of geographic atrophy. Annu Rev Vis Sci 2024;10:455-476.
12. Domalpally A, Danis R, Agrón E, et al; Age-Related Eye Disease Study 2 Research Group. Evaluation of geographic atrophy from color photographs and fundus autofluorescence images: Age-Related Eye Disease Study 2 report number 11. Ophthalmology 2016;123:2401-2407.
13. Lei J, Al-Sheikh M, et al. Reliability of confocal white-light fundus imaging for measurement of retina pigment epithelial atrophy in age-related macular degeneration. Retina 2018;38:1930-1936.
14. Domalpally A, Danis RP, White J, et al. Circularity index as a risk factor for progression of geographic atrophy. Ophthalmology 2013;120:2666-2671.
15. Pfau M, Lindner M, Goerdt L, et al; Fundus Autofluorescence in Age-Related Macular Degeneration Study Group. Prognostic value of shape-descriptive factors for the progression of geographic atrophy secondary to age-related macular degeneration. Retina 2019;39:1527-1540.
16. Feuer WJ, Yehoshua Z, Gregori G, et al. Square root transformation of geographic atrophy area measurements to eliminate dependence of growth rates on baseline lesion measurements: A reanalysis of Age-Related Eye Disease Study report no. 26. JAMA Ophthalmol 2013;131:110-111.
17. Patel SS, Lally DR, Hsu J, et al. Avacincaptad pegol for geographic atrophy secondary to age-related macular degeneration: 18-month findings from the GATHER1 trial. Eye (Lond) 2023;37:3551-3557.
18. Shen LL, Sun M, Ahluwalia A, et al. Geographic atrophy growth is strongly related to lesion perimeter: Unifying effects of lesion area, number, and circularity on growth. Ophthalmol Retina 2021;5:868-878.
19. Moult EM, Shi Y, Wang L, et al. Comparing accuracies of length-type geographic atrophy growth rate metrics using atrophy-front growth modeling. Ophthalmol Sci 2022;2:100156.
20. Uji A, Nittala MG, Hariri A, et al. Directional kinetics analysis of the progression of geographic atrophy. Graefes Arch Clin Exp Ophthalmol 2019;257:1679-1685.
21. Lindner M, Böker A, Mauschitz MM, et al. Directional kinetics of geographic atrophy progression in age-related macular degeneration with foveal sparing. Ophthalmology 2015;122:1356-1365.
22. Chujo S, Quarta A, Corradetti G, et al. Photoreceptor density-dependent kinetics of geographic atrophy progression. Ophthalmol Sci 2026;6:7:101198.
23. Chujo S, Quarta A, Abbasgholizadeh R, et al. Development of a conceptual, HOV-inspired spatial weighting model for quantifying geographic atrophy severity. Graefes Arch Clin Exp Ophthalmol. June 20, 2026 [Epub ahead of print].